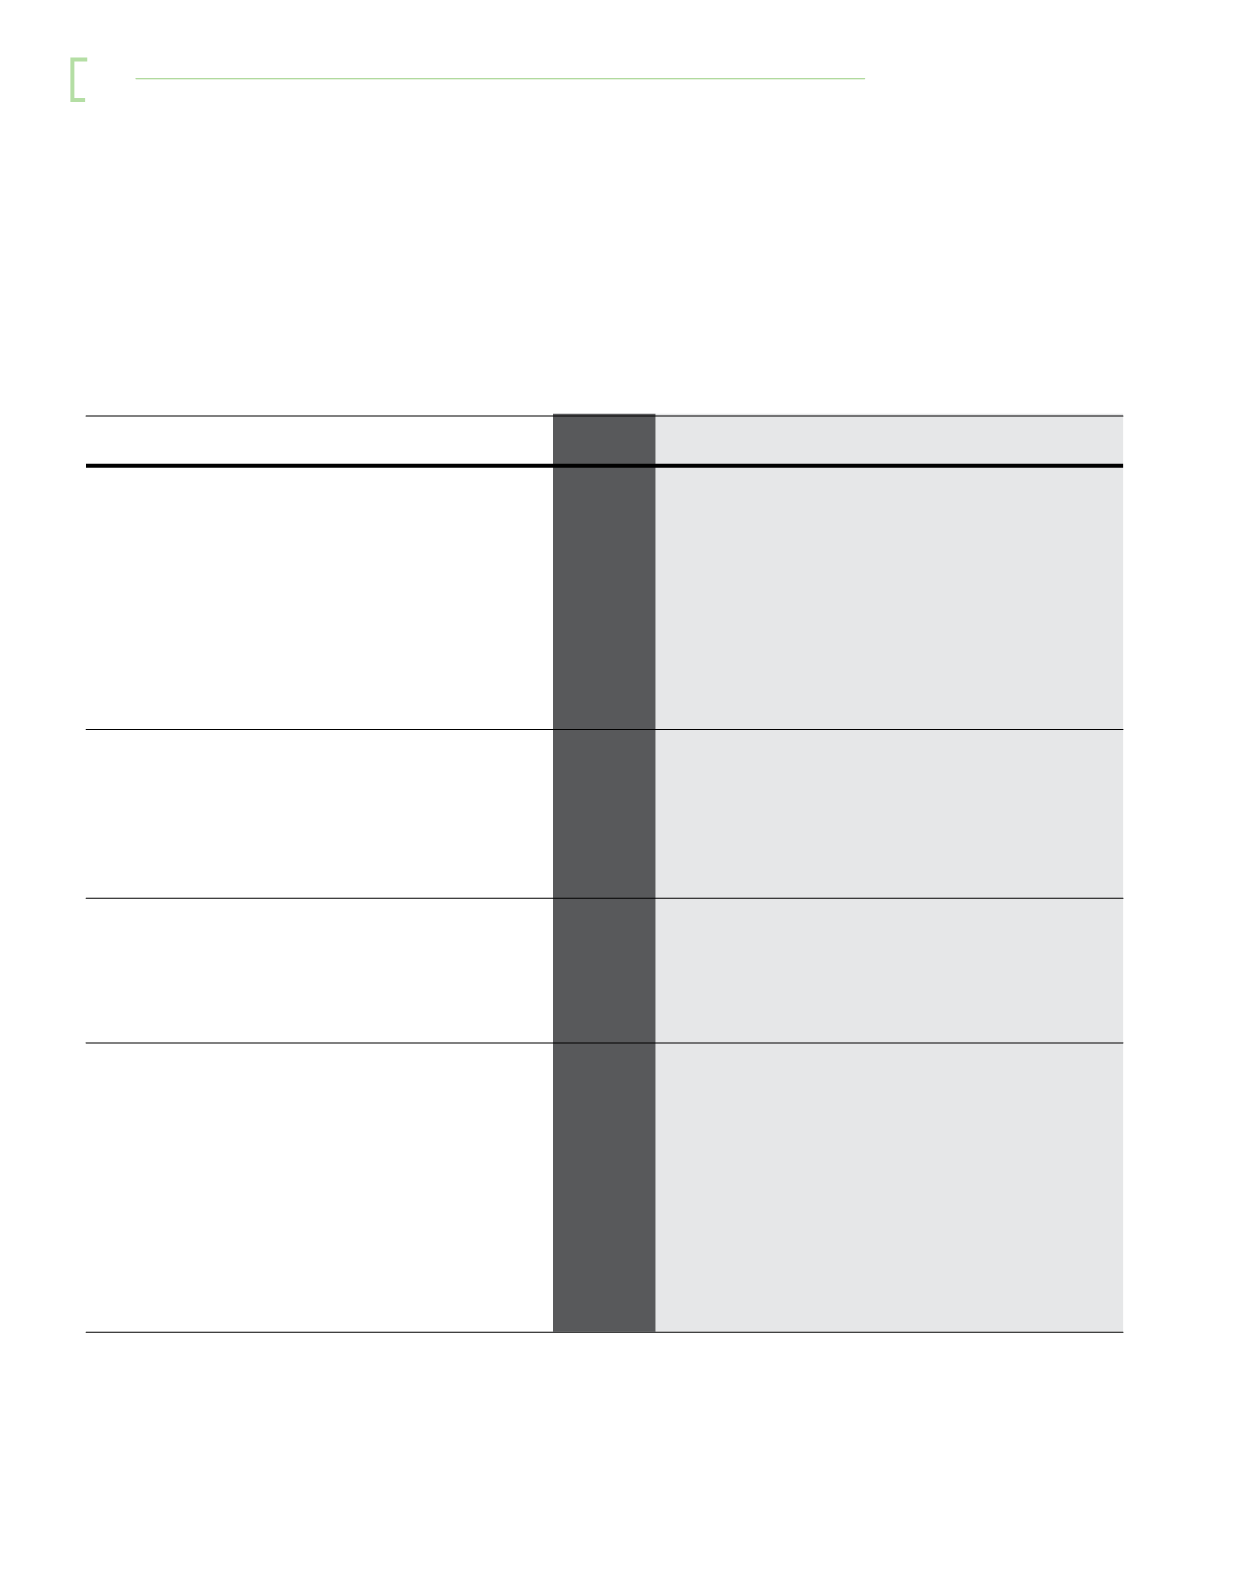
five-year
financial
highlights
2015
2014
2013
2012
2011
FINANCIAL PERFORMANCE
Revenue
615
717
770
877
1,011
Profit before taxation
95
90
359
184
332
Profit after taxation
72
52
331
144
308
Profit attributable to shareholders
79
57
333
131
268
Earnings per share
sen
4.9
4.3
32.7
12.8
26.3
Return on equity
%
3.5
3.1
23.6
9.8
23.1
Return on asset
%
3.6
4.1
13.7
8.9
20.8
Return on revenue
%
9.8
17.9
18.6
18.9
25.0
DIVIDENDS
Dividend declared
208
96
90
59
186
Net dividend per share
sen
13
6
72
47
149
Dividend yield - net of tax
%
8.7
4.1
-
-
-
Dividend cover
times
0.4
0.6
3.7
2.2
1.4
GEARING
Borrowings
915
841
977
679
160
Gearing
times
0.4
0.4
0.7
0.5
0.1
Interest cover
times
3.1
2.5
11.2
12.9
32.5
OTHER FINANCIAL STATISTICS
Net assets per share
sen
136
143
1,116
1,154
980
Share price - high
sen
150
164
-
-
-
Share price - low
sen
116
140
-
-
-
Price earnings ratio
times
30.4
33.5
-
-
-
Paid up share capital
800
800
125
125
125
Numbers of issued share capital
million
1,600
1,600
125
125
125
Shareholders’ equity
2,182
2,295
1,390
1,437
1,221
Total equity
2,228
2,348
1,449
1,498
1,269
Total assets
3,299
3,303
3,259
2,330
1,705
All figures are in RM million unless otherwise stated.
Note:
The above historical financial summary may not be comparable across the periods due to changes in the
Group’s structure as well as the effects of the intial public offering in 2014.
Bo ustead plantati o ns Berhad
22


